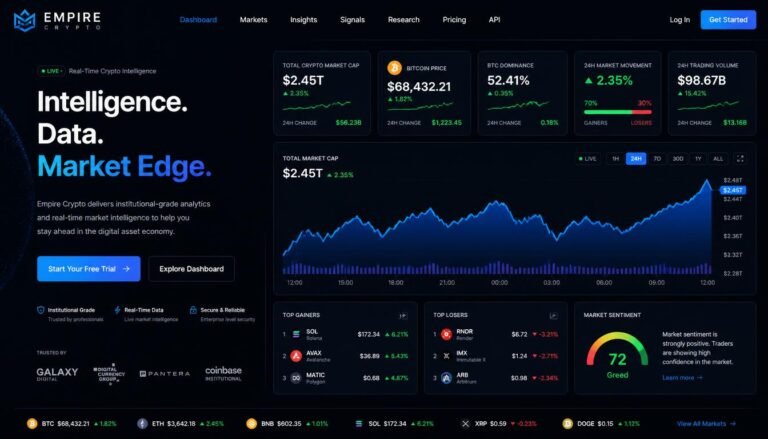
Navigating the digital asset market without accurate crypto data is like attempting to sail across an ocean in pitch darkness without a compass. Prices fluctuate rapidly, market trends shift in milliseconds, and social media hype frequently obscures true fundamental value. To achieve consistent success, modern investors must rely on reliable market signals rather than emotional impulse. Welcome to Crypto Data: Trusted Guide to Cryptocurrency, your premier blueprint for mastering digital asset analysis.

What is Crypto Data?
At its core, crypto data refers to the raw and processed information generated across blockchain networks, centralized exchanges (CEXs), decentralized exchanges (DEXs), and social sentiment platforms. Unlike traditional financial markets—where institutional data is often locked behind expensive terminal subscriptions—the blockchain is inherently public. Every single transaction, wallet balance, and smart contract interaction is immutably recorded.
However, raw blockchain code is virtually unreadable for human eyes. That is where a specialized crypto data company steps in: transforming billions of fragmented on-chain records into structured, easy-to-digest visual charts and metrics.
The 4 Major Pillar Categories of Cryptocurrency Data
To build a well-rounded trading strategy, you must monitor four distinct categories of cryptocurrency data:
- Market Data: Includes price actions, 24-hour trading volume, order book depth, bid-ask spreads, and market capitalization across various trading pairs.
- On-Chain Data: Tracks active wallet addresses, transaction counts, whale movements, miner reserves, and Total Value Locked (TVL) within smart contracts.
- Derivatives Data: Examines futures and options metrics, including Open Interest (OI), funding rates, long/short ratios, and liquidation heatmaps.
- Sentiment & Social Data: Measures crowd sentiment via search trends, developer activity on GitHub, social media engagement volume, and indexes like the Crypto Fear & Greed Index.
Why Cryptocurrency Data Reliability is Critical
In a market where wash trading, artificial volume inflation, and flash crashes can occur, cryptocurrency data reliability is paramount. Relying on corrupted or manipulated data feeds can result in severe slippage, bad entries, and unexpected liquidations. High-quality crypto data solutions filter out artificial noise, aggregate liquidity across hundreds of global exchanges, and verify on-chain records directly against network nodes.
About Empire Crypto Data & Empire Blockworks
When evaluating digital assets, the source of your information matters just as much as the metrics themselves. Empire Crypto Data was established to eliminate information asymmetry between institutional funds and everyday retail investors.
As a vanguard crypto data company, Empire Crypto Data bridges the gap between raw blockchain telemetries and executable trading strategies. By offering robust, high-frequency data architecture, Empire Crypto Data enables users to visualize market structure with institutional-grade precision.
         +-----------------------------------------------------+
         |                EMPIRE BLOCKWORKS                    |
         |         (Node Infrastructure & Data Layer)          |
         +-----------------------------------------------------+
                                    │
                                    ▼
         +-----------------------------------------------------+
         |                 EMPIRE CRYPTO DATA                  |
         |        (Analytics Engine & User Dashboards)         |
         +-----------------------------------------------------+
                                    │
                                    ▼
         +-----------------------------------------------------+
         |                   EMPIRE CRYPTO                     |
         |         (Ecosystem & Community Intelligence)        |
         +-----------------------------------------------------+
The Role of Empire Blockworks in Modern Data Architecture
Behind every seamless dashboard provided by Empire Crypto Data lies the computational backbone of Empire Blockworks. Dedicated to infrastructure development, Empire Blockworks maintains high-speed RPC nodes, indexing engines, and real-time data pipelines across major Layer-1 and Layer-2 blockchains.
Through Empire Blockworks, users gain access to:
- Ultra-Low Latency Market Feeds: Direct connectivity to high-throughput blockchains like Solana, Ethereum, Arbitrum, and Bitcoin.
- Cross-Chain Normalization: Unifying disparate token standards and smart contract logs into a standardized crypto market data schema.
- Predictive Analytics Engines: Machine-learning algorithms that flag unusual wallet accumulation patterns before market movements occur.
By combining the structural power of Empire Blockworks with the analytical front-end of Empire Data, the Empire Crypto ecosystem empowers traders to stay several steps ahead of the crowd.
Essential Crypto Data Metrics Every Beginner Must Know
If you are new to digital asset analysis, the sheer volume of numbers can feel overwhelming. Fortunately, mastering a few core metrics through Crypto Data will instantly elevate your market literacy.
1. Market Capitalization vs. Fully Diluted Valuation (FDV)
Market Capitalization calculates the total current dollar value of a cryptocurrency’s circulating supply:
$$\text{Market Cap} = \text{Current Price} \times \text{Circulating Supply}$$
However, smart investors also evaluate Fully Diluted Valuation (FDV):
$$\text{FDV} = \text{Current Price} \times \text{Max Supply}$$
Key Rule of Thumb: If a project has a low Market Cap but an extremely high FDV, a massive influx of new tokens will enter the market in future unlocks. This creates heavy sell pressure, making the current price difficult to sustain over time.
2. 24-Hour Trading Volume and Volume-to-Market-Cap Ratio
Trading volume reflects the liquidity and active interest in a specific asset over a 24-hour window. Comparing volume to market cap reveals market momentum:
- High Volume-to-Market-Cap (>15%): Indicates intense market activity, high liquidity, and strong price discovery.
- Low Volume-to-Market-Cap (<2%): Indicates illiquid assets susceptible to rapid price manipulation and heavy slippage.
3. Liquidity Depth and Bid-Ask Spread
Never rely solely on price charts. Always check the order book depth. A narrow bid-ask spread means high market efficiency, while a wide spread signals illiquidity. Crypto Data tools aggregate order books across top exchanges to show how much dollar value is needed to move an asset’s price by 2% in either direction.
Real-World Example: Spotting a Fake Breakout
Imagine Token X spikes 25% in price within 2 hours. A novice trader jumps in due to Fear Of Missing Out (FOMO). However, a trader using Crypto Data checks the underlying metrics:
Because trading volume didn’t validate the price jump and whale exchange deposits surged, the Crypto Data framework identifies a classic trap. The price dumps back to initial levels shortly after, saving the informed trader from significant losses.
Advanced On-Chain and Derivatives Data Analysis Cryptocurrency
Once you have mastered basic market metrics, intermediate and professional traders must dive into advanced trading data analysis cryptocurrency indicators to understand macro cycle tops and bottoms.
Key On-Chain Metrics for Market Cycles
1. MVRV Z-Score (Market Value to Realized Value)
The MVRV Z-Score compares the total market capitalization of an asset against its Realized Value (the price at which each token last moved on-chain).
- Z-Score > 5.0 (Red Zone): Indicates extreme market overvaluation historically associated with macro market tops.
- Z-Score < 0.1 (Green Zone): Indicates that the asset is trading below its aggregate cost basis, representing historic generational buying opportunities.
2. SOPR (Spent Output Profit Ratio)
SOPR measures whether spent tokens on-chain are moving at a profit or a loss:
$$\text{SOPR} = \text{USD Value at Spent Time} \div \text{USD Value at Creation Time}$$
- SOPR > 1.0: Investors are selling on-chain at a profit.
- SOPR < 1.0: Investors are capitulating and selling at a loss.
- SOPR Rebound at 1.0: During strong bull runs, SOPR frequently dips to 1.0 and bounces, as investors refuse to sell below their breakeven price.
Master Derivatives Insights: Funding Rates & Open Interest
Derivatives data offers a real-time window into institutional leverage. When analyzed alongside spot crypto market data, these indicators provide powerful market bias signals.
By leveraging cryptocurrency data analytics provided by platforms like Empire Crypto Data, traders can set automated alerts when funding rates reach extreme levels, allowing them to position themselves against over-leveraged market crowds.
How to Build a Winning Crypto Data Strategy (Step-by-Step)
Data alone is useless without an actionable execution framework. Follow this proven 4-step workflow to integrate crypto data solutions into your daily routine.
- Establish Your Core Horizon and Risk Profile: Match your metrics to your operational timeframe.
Define whether you are an active day trader, a swing trader, or a long-term value investor. Day traders prioritize real-time order books, liquidations, and high-frequency exchange funding rates. Long-term investors focus primarily on on-chain accumulation patterns, developer commit frequency, and macro MVRV models provided by Crypto Data.
2. Select Best Crypto Data Tools and Custom Feeds: Consolidate your research stack to avoid data fatigue.
Build a multi-layered analytical stack. Combine trusted market price aggregates, specialized on-chain query tools, and high-fidelity intelligence dashboards powered by Empire Crypto Data. Always verify that your platforms source raw data through resilient node infrastructure like Empire Blockworks.
3. Filter Market Noise and Verify Volume Authenticity: Cross-reference metrics to spot manipulative wash trading.
Cross-examine exchange volume with on-chain settlement activity. If an exchange reports billions in daily volume for a token, but the underlying blockchain shows negligible active wallet transfers, flag the reported volume as artificial wash trading. Rely on proven crypto data solution engines that adjust for manipulative behavior.
4. Execute Trades Based on Confluence Signals: Never enter positions based on a single isolated metric.
Wait for at least 3 confirming data signals before taking a position. For example, a high-probability buy signal occurs when:
- On-chain exchange reserves hit multi-year lows (less sell pressure).
- Derivatives funding rates turn neutral or slightly negative (leverage cleared).
- Whale wallet balances show steady accumulation over a 14-day window.
About Empire Crypto Data: Real Use Cases & Case Studies
To understand how Empire Crypto Data operates in real-world scenarios, let’s explore two distinct case studies where advanced crypto data analysis protected capital and amplified trading yields.
Case Study 1: Spotting DeFi Protocol Yield Sustainability
Scenario: A new decentralized lending protocol launched on an EVM chain, offering an astronomical 400% Annual Percentage Yield (APY) on stablecoin deposits. Retail investors rushed in, driving the token price upward.
Action via Empire Crypto Data: An intermediate yield farmer used Empire Crypto tools to analyze the protocol’s underlying revenue model:
Outcome: The data crypto analysis proved that 97% of the yield was paid out through inflationary token minting rather than actual protocol revenue. The investor avoided depositing funds. Three weeks later, token emissions hyper-inflated the asset, causing a 92% price collapse. The investor’s capital was preserved thanks to insights from Empire Crypto Data.

Case Study 2: Detecting Accumulation During Market Capitulation
Scenario: During a macro market drawdown, Bitcoin fell 30% over two weeks. Social sentiment reached extreme fear, and retail traders actively sold their holdings.
Action via Empire Crypto Data: Experienced traders utilizing Empire Crypto dashboards monitored macro accumulation metrics:
Outcome: While market sentiment was overwhelmingly negative, Empire Data revealed that smart money entities were aggressively absorbing retail panic selling. Traders who entered long positions based on this cryptocurrency market data captured a 45% recovery surge over the following month.
Comparing Free vs. Institutional Crypto Data Solutions
Not all data tools are created equal. Depending on your experience level and capital under management, choosing the right platform tier is vital.
| Feature / Metric | Free Standard Aggregators | Advanced Empire Crypto Data | Institutional Terminals |
| Data Latency | 1 to 5 Minutes Delayed | Real-Time / Sub-Second | Ultra Low Latency Direct API |
| On-Chain Tracking | Basic Transfer Volumes | Deep Wallet Labels & Smart Money | Forensic Clustering & AML |
| Derivatives Data | Basic Price & Open Interest | Liquidation Maps & Funding Spreads | Full Order Book Heatmaps |
| Custom Alerts | Limited / Email Only | Multi-Channel (Telegram, Webhook) | High-Frequency Webhooks |
| Data Cleanliness | Raw Exchange Feeds | Filtered Wash Trading Models | Fully Audited Exchange Feeds |
| Target User | Absolute Beginners | Active Traders & Investors | Hedge Funds & Quants |
Using best crypto data providers ensures that you aren’t trading on outdated or distorted pricing models. Empire Data balances institutional depth with beginner-friendly visualizations, making high-level analytics accessible to everyone.
Common Pitfalls When Analyzing Cryptocurrency Market Data
Even with access to modern data analytics cryptocurrency platforms, traders can fall into cognitive and analytical traps. Here are the most common pitfalls and how to avoid them:
1. The “Cheap Token” Unit Bias Fallacy
Beginners often assume a token priced at $0.0001 is “cheaper” and has more growth potential than a token priced at $500.
Correction: Price per unit is irrelevant without looking at supply. Always multiply the unit price by the circulating supply to determine Market Cap. A $0.0001 token with 10 trillion supply has a $1 Billion market cap, whereas a $500 token with 100,000 supply has only a $50 Million market cap!
2. Over-Reliance on Lagging Indicators
Technical indicators like Moving Averages (MA) and Relative Strength Index (RSI) are calculated strictly from past price action. During major macro shifts or black swan events, lagging indicators fail to predict sudden trend reversals. Combine technical chart setups with real-time on-chain flows from Crypto Data to gain leading context.
3. Ignoring Stablecoin Liquidity Waves
Stablecoin supply (USDT, USDC, USDS) represents the available dry powder in the crypto ecosystem. When total stablecoin market cap expands, fresh capital is entering the ecosystem—creating structural tailwinds for digital asset prices. Conversely, shrinking stablecoin market caps indicate capital flight back into fiat.
The Future of Crypto Data Solutions and AI Analytics
As blockchain adoption scales, the sheer volume of generated data grows exponentially. The future of crypto data solutions lies in the convergence of on-chain metrics and Artificial Intelligence (AI).
Key Trends Shaping the Next Era of Crypto Market Data
- AI-Powered Natural Language Queries: Instead of writing complex SQL queries to analyze smart contracts, users will ask platforms like Empire Crypto Data simple questions in plain language to get instant visual reports.
- Predictive Smart Money Tracking: Machine learning algorithms will automatically identify high-performing “smart money” wallets based on historical risk-adjusted returns, alerting users the second those wallets initiate fresh positions.
- Cross-Chain Unified Dashboards: As modular blockchains proliferate, tracking token flows across dozens of Layer-2s will become frictionless through integrated frameworks provided by Empire Blockworks.
Frequently Asked Questions (FAQ)
What is crypto data and why is it important?
Crypto data encompasses market prices, trading volumes, blockchain transactions, derivatives metrics, and social sentiment indicators. It is critical because it provides objective, verifiable insights that help investors make data-driven decisions rather than relying on speculation or emotion.
How does Empire Data improve cryptocurrency data reliability?
Empire Crypto Data leverages node infrastructure managed by Empire Blockworks to aggregate and verify data directly from blockchain ledger nodes and top tier global exchanges. By filtering out wash trading and artificial volume, Empire Crypto Data ensures high-fidelity analytics.
What is the difference between market data and on-chain data?
Market data refers to exchange-level information such as prices, order books, and trading volume. On-chain data refers to ledger activity recorded on the blockchain itself, including wallet address movements, transaction fees, miner activities, and smart contract TVL.
What are the most reliable indicators for identifying market cycle tops?
Historically, metrics such as the MVRV Z-Score (entering the red overvaluation zone), extreme SOPR spikes, massive whale inflows to centralized exchanges, and prolonged positive funding rates across derivatives markets serve as strong signals of market cycle tops.
Can beginners effectively use advanced crypto data solutions?
Yes! Modern platforms like Crypto Data transform complex raw blockchain analytics into simple visual dashboards, heatmaps, and plain-English alerts. Beginners can start with basic market cap and volume ratios before progressing to on-chain and derivatives metrics.
Conclusion: Master the Market with Crypto Data
In the digital asset ecosystem, information is the ultimate edge. Relying on guesswork, social media rumors, or outdated chart patterns leaves your portfolio vulnerable to sudden market swings. By adopting a disciplined approach to crypto data analysis, you empower yourself to navigate volatile market conditions with clarity and confidence.
Throughout this guide, we have explored how cryptocurrency data analytics unlocks the full narrative behind price movements—from basic volume depth to sophisticated on-chain accumulation patterns. Through the combined expertise of Empire Data, the infrastructure power of Empire Blockworks, and the insights of Empire Crypto, accessing accurate, high-fidelity market intelligence has never been easier.
Stop trading blind. Embrace the power of reliable crypto data solutions, optimize your research workflow, and take control of your financial destiny today!
Take Action Today with Empire Crypto Data
Ready to transform your trading strategy with institutional-grade insights?
- Explore Live Dashboards: Track real-time market movements, whale alerts, and liquidity heatmaps instantly.
- Join the Community: Connect with active market analysts and master advanced data crypto strategies inside the official Empire Crypto network.
- Upgrade Your Intelligence: Elevate your portfolio management with seamless cryptocurrency data tools tailored for every level of investor.
Bookmark Crypto Data now and never miss a market signal again!