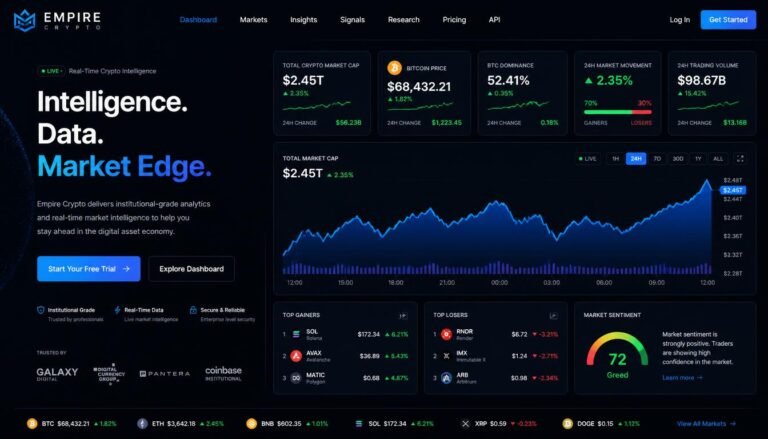
Navigating the digital asset landscape feels like sailing across a vast ocean filled with immense opportunity and hidden, dangerous reefs. Every day, millions of traders analyze price charts, monitor social media trends, and scan coin market rankings looking for the next breakout token. However, relying solely on surface-level price action exposes investors to severe structural threats that standard charts completely hide. Welcome to Crypto Data: Hidden Crypto Risks Explained, the ultimate breakdown brought to you by Crypto Data, your premier resource for market intelligence, risk mitigation, and institutional-grade analytics.

What Is Crypto Data and Why Does It Matter?
Before diving into hidden risks, let’s define what modern crypto market data actually encompasses. In traditional financial markets like stocks or commodities, market data is strictly aggregated from regulated exchanges like the NYSE or Nasdaq. In contrast, cryptocurrency data is decentralized, fragmented across hundreds of centralized and decentralized exchanges (DEXs), and generated 24/7 directly on public blockchains.
+-----------------------------------------------------------------------+
|                   THE THREE PILLARS OF CRYPTO DATA                     |
+-----------------------------------------------------------------------+
|  1. OFF-CHAIN DATA         2. ON-CHAIN DATA         3. DERIVATIVES    |
|  • Order book depth       • Active addresses       • Open interest    |
|  • Exchange trade feeds   • Whale wallet transfers • Funding rates    |
|  • Bid-ask spreads        • Smart contract calls   • Liquidations     |
+-----------------------------------------------------------------------+
The Three Pillars of Crypto Market Intelligence
- Off-Chain Market Data: Raw pricing, order book depth, bid-ask spreads, and trading execution logs collected from centralized exchanges (CEXs).
- On-Chain Blockchain Metrics: Public ledger data including active wallet addresses, token transfer volumes, miner/staker behaviors, smart contract interactions, and whale portfolio movements.
- Derivatives and Sentiment Signals: Open interest (OI), funding rates, liquidation heatmaps, long/short ratios, and social sentiment indexes.
When synthesized correctly through a reliable crypto data solution, these three data streams reveal the absolute truth about market structure. However, when bad actors manipulate this information, uninformed traders face catastrophic losses.
At Crypto Data, our core mission is to filter out the noise, eliminate artificial signals, and give you clean, verifiable intelligence. To build a resilient trading strategy, you must first understand the specific hidden risks buried beneath surface-level metrics.
The Hidden Risk Spectrum: 7 Danger Zones Explained
+-----------------------------------------------------------------------+
|                   THE HIDDEN CRYPTO RISK SPECTRUM                     |
+-----------------------------------------------------------------------+
| [1] Phantom Liquidity & Wash Trading                                  |
| [2] Toxic Tokenomics & Predatory Unlock Schedules                    |
| [3] Smart Contract Vulnerabilities & Centralization Vectors           |
| [4] MEV Exploitation & Sandwich Attacks                               |
| [5] Oracle Manipulation & Flash Loan Attacks                          |
| [6] Derivatives Leverage Contagion & Liquidation Cascades             |
| [7] Fake On-Chain Activity & Sybil Volume Inflation                   |
+-----------------------------------------------------------------------+
Risk Zone 1: Phantom Liquidity and Wash Trading
One of the most rampant forms of market manipulation in digital assets is wash trading. Wash trading occurs when an entity simultaneously buys and sells the same cryptocurrency to create the illusion of high trading activity, liquidity, and organic user interest.
How Wash Trading Tricked Retail Investors
- The Illusion: A new altcoin lists on a secondary exchange showing $50 million in daily trading volume. Retail traders jump in, assuming high liquidity means easy entry and exit.
- The Reality: Up to 90% of that reported volume is generated by two automated bot accounts buying and selling the exact same tokens back and forth to each other without taking on true market risk.
- The Danger: When a real trader tries to sell a $10,000 position, the price crashes by 40% because genuine order book depth is practically non-existent.
Through trading data analysis cryptocurrency frameworks, Crypto Data exposes phantom volume by checking trade size distributions, order book cancellation ratios, and cross-exchange price arbitrage anomalies. Without advanced data crypto verification, you risk entering tokens where exit liquidity is a complete illusion.
Risk Zone 2: Toxic Tokenomics and Predatory Unlock Schedules
A coin’s market price alone tells you almost nothing about its long-term financial health. The hidden risk lies within its underlying tokenomics—specifically fully diluted valuation (FDV) and cliff unlock schedules.
+-----------------------------------------------------------------------+
|                     CIRCULATING SUPPLY VS. FDV                        |
+-----------------------------------------------------------------------+
| Token A:                                                              |
|   • Current Price: $1.00                                              |
|   • Circulating Supply: 10,000,000 tokens                             |
|   • Reported Market Cap: $10,000,000                                  |
|   • Total Max Supply: 1,000,000,000 tokens                            |
|   • Fully Diluted Valuation (FDV): $1,000,000,000                     |
|                                                                       |
| RISK FACTOR: 99% of total tokens are locked and waiting to hit the    |
| market over the next 12 months. Constant inflation guarantees downward|
| price pressure on retail buyers.                                      |
+-----------------------------------------------------------------------+
Understanding the FDV Trap
Many newly launched projects inflate their opening price by circulating only 2% to 5% of the total token supply. While the initial market capitalization looks modest (e.g., $20 million), the Fully Diluted Valuation (FDV) sits at a massive $1 billion.
When venture capital (VC) funds and team members unlock their remaining 95% token allocations over subsequent months, millions of new tokens flood the open market. Unless buying demand increases exponentially, the asset’s price inevitably plummets under structural sell pressure.
Evaluating cryptocurrency data reliability requires tracking unlock schedules, insider wallet holdings, and emission schedules before opening a long-term spot position. Empire Crypto Data equips traders with granular tokenomic dashboards to spot these hidden supply inflation traps before they impact portfolios.
Risk Zone 3: Smart Contract Vulnerabilities and Centralization Vectors
In decentralized finance (DeFi), code is law—until that code contains a critical bug or a hidden backdoor. Even tokens that appear fully decentralized often retain centralized administrative controls.
+-----------------------------------------------------------------------+
|                 SMART CONTRACT DANGER SIGNALS                         |
+-----------------------------------------------------------------------+
| [!] Unrenounced Ownership (Owner can mint unlimited tokens)           |
| [!] High Proxy Upgradability Risks (Code can change without notice)    |
| [!] Blacklist Functions (Admin can freeze specific wallet addresses)   |
| [!] Variable Selling Taxes (Admin can adjust sell tax to 99%)         |
| [!] Unlocked Liquidity Pools (Developers can pull LP tokens instantly)|
+-----------------------------------------------------------------------+
Real-World Example: The Honeypot Contract
A trader notices a micro-cap token surging 500% in a single afternoon. They purchase $500 worth through a DEX. Two hours later, the price has doubled again, but when they try to sell, every transaction fails with an execution error.
What happened? The smart contract contained a hidden conditional line of code that restricted selling permissions exclusively to whitelisted developer addresses. The token was a honeypot—a complete loss for retail participants.
By utilizing smart contract audit feeds and code-scanning tools provided by Empire Crypto, users can quickly verify if a contract has blacklisting capabilities, unrenounced admin keys, or variable transfer tax functions.
Risk Zone 4: Maximum Extractable Value (MEV) and Sandwich Attacks
When you submit a swap order on a decentralized exchange, your transaction does not instantly enter the blockchain block. Instead, it enters a public waiting room called the mempool.
+-----------------------------------------------------------------------+
|                    MECHANICS OF A SANDWICH ATTACK                     |
+-----------------------------------------------------------------------+
| STEP 1: MEV Bot detects your incoming DEX buy order in the mempool.   |
| STEP 2: Bot pays higher gas fee to place a buy order BEFORE yours.    |
| STEP 3: Your trade executes at a artificially inflated, higher price. |
| STEP 4: Bot executes a sell order immediately AFTER your trade.       |
| RESULT: The MEV bot extracts profit directly from your price slippage.|
+-----------------------------------------------------------------------+
Automated MEV searcher bots monitor the mempool around the clock for high-value retail orders. If your slippage tolerance is set too high (e.g., 3% to 5%), an MEV bot will execute a “sandwich attack”:
- The bot fronts-runs your transaction by buying the token right before you, driving the price up.
- Your transaction executes at that higher, inflated price.
- The bot back-runs your transaction by selling its tokens immediately after, locking in risk-free profit.
This front-running drains value directly from everyday traders. Analyzing DEX transaction routing through crypto data analysis enables traders to set optimal slippage limits and use private RPC endpoints to bypass public mempool exploitation.
Risk Zone 5: Oracle Manipulation and Flash Loan Attacks
Decentralized lending protocols and synthetic asset platforms rely on price oracles (like Chainlink or Pyth Network) to fetch real-world price data for smart contracts. When a DeFi platform relies on an illiquid or single-source price oracle, bad actors can exploit it through flash loan attacks.
Step-by-Step Anatomy of an Oracle Exploit
- Borrowing Capital: An attacker takes out an uncollateralized $50 million flash loan in a single transaction block.
- Manipulating the Oracle: The attacker dumps $40 million into a low-liquidity DEX pool that serves as the price oracle for a DeFi lending protocol. This temporarily crashes the apparent price of Token X by 80%.
- Exploiting the Protocol: The attacker uses the remaining $10 million to purchase artificially cheap Token X and deposit it into the lending protocol, or liquidate other users’ under-collateralized positions at a massive discount.
- Repaying the Loan: The attacker swaps the assets back, repays the flash loan within the same block, and walks away with millions in stolen protocol funds.
Without real-time cryptocurrency market data feeds that track cross-venue order depth and oracle sanity checks, DeFi depositors risk waking up to find their lending pools drained overnight.
Risk Zone 6: Derivatives Leverage Contagion and Liquidation Cascades
The crypto derivatives market—composed of perpetual futures, options, and margin trading—frequently dictates spot market prices. High leverage acts as fuel for sudden, catastrophic price movements known as liquidation cascades or “long/short squeezes”.
+-----------------------------------------------------------------------+
|                  LIQUIDATION CASCADE MECHANICS                        |
+-----------------------------------------------------------------------+
| [1] High Open Interest + Over-leveraged Long Positions                |
| [2] Unexpected Selling Pressure Triggers Initial Stop-Losses           |
| [3] Automatic Forced Liquidations Dump Spot/Perps onto Order Book    |
| [4] Price Drops Rapidly -> Triggers Deeper Liquidation Thresholds     |
| [5] Result: Flash Crash (Price drops 20%-40% in minutes)              |
+-----------------------------------------------------------------------+
When open interest surges while funding rates reach extreme positive or negative levels, the market becomes top-heavy. A small $500 decline in Bitcoin’s price can trigger forced liquidations of $100 million in leveraged long positions. As exchange liquidation engines automatically sell off these positions to cover debt, price crashes further, triggering the next tier of liquidations.
Understanding perpetual futures funding rates and open interest maps provided by Crypto Data allows traders to spot market over-extension before these brutal liquidation cascades occur.
Risk Zone 7: Sybil Attacks and Fake On-Chain User Metrics
To attract valuation funding and crypto community hype, many layer-1 and layer-2 blockchains promote vanity metrics like “Total Daily Active Addresses” or “Daily Transaction Count”.
+-----------------------------------------------------------------------+
|                     VANITY METRICS VS. TRUE DATA                      |
+-----------------------------------------------------------------------+
| REPORTED METRIC: 1,000,000 Daily Active Addresses                     |
| ACTUAL ON-CHAIN REALITY:                                              |
|   • 950,000 addresses are automated scripts executing $0.01 swaps     |
|   • Only 50,000 addresses belong to unique, organic human users       |
|                                                                       |
| VERdict: High network activity is a Sybil-driven marketing illusion.  |
+-----------------------------------------------------------------------+
In a Sybil attack, a single developer or bot operator creates thousands of unique wallet addresses and executes automated, low-cost micro-transactions. To a surface-level observer looking at basic block explorers, the network appears to be exploding in organic adoption. In reality, one entity is generating 90%+ of the network’s volume to fake user retention.
Advanced data analytics cryptocurrency solutions filter out Sybil activity by tracking cohort retention, gas spending distributions, wallet clustering algorithms, and capital inflows. At Crypto Data, we prioritize true fundamental utility over inflated marketing numbers.
Beginner vs. Advanced Risk Analysis Frameworks
Whether you are placing your very first trade or managing a complex multi-asset crypto portfolio, risk analysis must be tailored to your experience level. Here is how to apply structured crypto data evaluation at every stage of your trading journey.
+-----------------------------------------------------------------------+
|                    RISK ANALYSIS MATRIX BY LEVEL                      |
+-----------------------------------------------------------------------+
| FEATURE                  | BEGINNER LEVEL     | ADVANCED LEVEL        |
+--------------------------+--------------------+-----------------------+
| Primary Focus            | Capital Safety     | Edge & Risk Metrics   |
| Core Tool                | Basic Token Check  | On-Chain & Derivs API |
| Key Indicators           | Liquidity, FDV     | VaR, MEV, Funding     |
| Main Goal                | Avoid Scams        | Optimize Alpha        |
+--------------------------+--------------------+-----------------------+
The Beginner Framework: The 4-Step Checklist
If you are new to the cryptocurrency market, avoid getting bogged down in complex mathematical models. Instead, run every prospective asset through this 4-step checklist powered by best crypto data standards:
[Step 1: Check Exchange Liquidity Depth]
        │
        ▼
[Step 2: Inspect FDV & Unlock Schedule]
        │
        ▼
[Step 3: Verify Smart Contract Security]
        │
        ▼
[Step 4: Check Wallet Concentration Ratio]
Step 1: Check Liquidity Depth over Reported Volume
Do not trust 24-hour reported volume alone. Open the order book depth charts on major venues. Ensure there is at least 2% order book depth within $50,000 of the current market price. If $10,000 worth of selling pressure causes a 15% price crash, skip the asset.
Step 2: Compare Market Cap against Fully Diluted Valuation (FDV)
Calculate the FDV ratio:
$$\text{FDV Ratio} = \frac{\text{Circulating Market Cap}}{\text{Fully Diluted Valuation}}$$
If the ratio is below 0.15 (meaning less than 15% of tokens are currently circulating), prepare for heavy structural dilution as team and VC tokens unlock over time.
Step 3: Run Smart Contract Code Scanners
Use automated contract inspection tools to scan for unrenounced ownership, minting functions, or hidden sell taxes. If the contract owner can arbitrarily modify transfer logic, treat the project as extremely high risk.
Step 4: Analyze Wallet Concentration Ratios
Check token holder distribution on the blockchain explorer. If the top 10 non-exchange wallet addresses hold more than 50% of the total circulating supply, a single insider selling off can wipe out the entire liquidity pool.
The Advanced Framework: Quantitative Metrics for Experienced Traders
Intermediate and institutional traders need sophisticated risk models to protect capital during market regime shifts. Below are three core quantitative frameworks utilized by Empire Crypto analysts and professional risk managers.
1. Value at Risk (VaR) and Expected Shortfall (ES)
Value at Risk quantifies the maximum potential loss over a specific timeframe (e.g., 1 day or 1 week) at a given confidence level (e.g., 95% or 99%).
$$\text{VaR}_{\alpha}(X) = -\inf \{ x \in \mathbb{R} : P(X \le x) > 1 – \alpha \}$$
Because cryptocurrency return distributions feature “fat tails” (extreme skewness and kurtosis), standard normal distribution assumptions fail. Advanced analysts use Historical Simulation VaR paired with Expected Shortfall (Conditional VaR) to measure tail-risk exposure during black swan events like market flash crashes.
+-----------------------------------------------------------------------+
|                     VALUE AT RISK (VaR) ILLUSTRATION                  |
+-----------------------------------------------------------------------+
|          Probability Distribution of Daily Crypto Returns             |
|                                                                       |
|                          /\                                           |
|                         /  \                                          |
|                        /    \                                         |
|                       /      \                                        |
|     FAT TAIL RISK    /        \                                       |
|     (Extreme Losses)/          \                                      |
|    |~~~~~~~~~~~~~~~|            \                                     |
|  <-[ Expected Shortfall ]--------|                                    |
|                  ^ VaR Threshold (99%)                                |
+-----------------------------------------------------------------------+
2. GARCH Volatility Modeling
Simple historical standard deviation fails to capture crypto’s volatility clustering—the financial phenomenon where high-volatility periods cluster together and low-volatility periods cluster together.
Applying GARCH(1,1) models provides forward-looking conditional volatility forecasts:
$$\sigma_t^2 = \omega + \alpha \epsilon_{t-1}^2 + \beta \sigma_{t-1}^2$$
Where:
- $\sigma_t^2$ is tomorrow’s forecast variance.
- $\omega$ is the baseline variance weight.
- $\epsilon_{t-1}^2$ represents yesterday’s shock (news/market event).
- $\sigma_{t-1}^2$ represents yesterday’s variance persistence.
Utilizing GARCH modeling through a crypto data solution enables automated position sizing that contracts during high-volatility regimes and expands during stable consolidation phases.
3. Realized Cap vs. Market Cap (MVRV Z-Score)
On-chain analysts rely on the MVRV Z-Score to identify macro market tops and bottoms:
$$\text{MVRV Z-Score} = \frac{\text{Market Capitalization} – \text{Realized Capitalization}}{\sigma_{\text{Market Cap}}}$$
Where Realized Capitalization values each coin at the price it was last moved on the blockchain, rather than its current market price. An MVRV Z-Score above 5.0 historically signals extreme market overheating (high risk of a major crash), while scores below 0.0 indicate generational buying opportunities.
Real-World Case Studies: When Hidden Risks Materialize
To understand the real-world impact of these hidden threats, let’s examine two major historical events where poor data analysis led to billions in investor losses.
+-----------------------------------------------------------------------+
|                    LESSONS FROM REAL-WORLD CRASHES                   |
+-----------------------------------------------------------------------+
| ANATOMY OF A COLLAPSE:                                                |
|                                                                       |
|   SURFACE SIGNAL            HIDDEN DATA RISK          OUTCOME         |
| ───────────────────       ─────────────────────    ─────────────      |
| High Staking APY (20%) →  Algorithmic Death Loop →  $40B Wipeout      |
| Flawless Solvency PR  →  Off-Balance Sheet Debt →  Bankruptcy ($8B)  |
+-----------------------------------------------------------------------+
Case Study 1: The Algorithmic Death Loop (Terra/Luna Collapse)
In early 2022, the Terra ecosystem skyrocketed to become a top-10 crypto project, powered by its algorithmic stablecoin UST and the Anchor Protocol offering a 20% annual yield.
- The Surface Metric: UST maintained its $1.00 peg, and LUNA reached an all-time high market cap exceeding $40 billion.
- The Hidden Risk: On-chain cryptocurrency data analytics revealed that over 75% of all UST in existence was deposited inside a single lending protocol (Anchor). The yield was subsidized by reserves rather than organic protocol revenues.
- The Trigger: When large capital holders began withdrawing UST and selling it across DEX pools, the algorithmic rebalancing mechanism forced hyper-inflation of the LUNA token supply.
- The Result: Within 72 hours, LUNA’s circulating supply exploded from 350 million tokens to over 6.5 trillion tokens, wiping out $40 billion in wealth. Traders tracking real-time mint/burn ratios on Crypto Data exited their positions long before the total collapse occurred.
Case Study 2: Centralized Exchange Insolvency (FTX Failure)
In late 2022, FTX was viewed as one of the most liquid and secure centralized exchanges in the world.
- The Surface Metric: Reported exchange trading volume regularly exceeded $10 billion per day.
- The Hidden Risk: On-chain wallet analytics showed massive capital outflows from FTX reserves toward Alameda Research. Furthermore, Alameda’s balance sheet was heavily backed by illiquid, self-issued FTT tokens rather than fiat reserves or Bitcoin.
- The Trigger: A run on the exchange exposed an $8 billion hole in customer funds, leading to immediate bankruptcy and a global crypto market crash.
- The Takeaway: Trusting exchange balance statements without verifying on-chain proof-of-reserves data leaves traders exposed to severe counterparty risks.
Practical Guide: How to Mitigate Hidden Crypto Risks
Now that you understand the hidden threat landscape, let’s look at actionable steps you can take today to safeguard your digital asset investments.
+-----------------------------------------------------------------------+
|                    STEP-BY-STEP RISK MITIGATION                       |
+-----------------------------------------------------------------------+
| [Step 1] Transition to Cold Storage & Multi-Sig Custody               |
| [Step 2] Utilize Non-Custodial DEX Aggregators                        |
| [Step 3] Set Up Real-Time On-Chain Wallet Alerts                      |
| [Step 4] Implement Dynamic Position Sizing Rules                      |
| [Step 5] Audit Smart Contracts via Empire Crypto Tools                |
+-----------------------------------------------------------------------+
Actionable Security Checklist
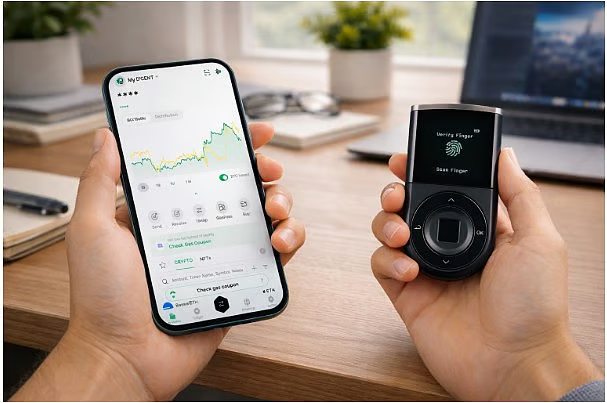
- Self-Custody Assets: Do not leave long-term investments on centralized exchanges. Move assets to hardware cold storage wallets where you retain private key ownership.
- Use DEX Aggregators: Route trades through liquidity aggregators that split orders across multiple decentralized venues to minimize slippage and eliminate sandwich attacks.
- Monitor On-Chain Exchange Reserves: Track wallet balances of centralized exchanges using cryptocurrency market data feeds. If exchange reserves show sudden, unexplained outflows, move your funds to non-custodial wallets immediately.
- Diversify Across Uncorrelated Assets: Avoid over-concentrating your portfolio in a single layer-1 network ecosystem. Spread risk across Bitcoin, Ethereum, liquid blue-chips, and traditional cash reserves.
- Leverage Institutional Analytics: Integrate crypto data solutions provided by Empire Crypto Data to automate risk management, monitor token unlock alerts, and track insider wallet movements in real time.
About Empire Crypto Data
At Empire Crypto Data, we believe that transparency is the bedrock of financial freedom. As a leading crypto data company, Empire Crypto Data provides traders, researchers, and institutions with institutional-grade risk metrics, real-time on-chain telemetry, and predictive market intelligence.
+-----------------------------------------------------------------------+
|                    ABOUT EMPIRE CRYPTO DATA                           |
+-----------------------------------------------------------------------+
| CORE SERVICES:                                                        |
|   • Institutional On-Chain & Off-Chain Analytics                      |
|   • Real-Time Liquidity & Wash Trading Detection                      |
|   • Tokenomics & Cliff Unlock Monitoring                              |
|   • Quantitative Risk Modeling (VaR, GARCH, MVRV)                     |
|                                                                       |
| ECOSYSTEM PARTNERS:                                                   |
|   • Empire Crypto  |  Empire Blockworks  |  Crypto Data Labs          |
+-----------------------------------------------------------------------+
Through our suite of services—including Empire Crypto, Empire Blockworks, and our state-of-the-art crypto market data pipeline—we empower users to see beyond superficial price movements. Whether you need clean historical datasets for backtesting, real-time MEV alert systems, or bespoke cryptocurrency data reliability audits, Empire Crypto Data delivers the clarity required to navigate volatile digital asset markets with confidence.
Frequently Asked Questions (FAQ)
What is the primary difference between on-chain data and off-chain data?
On-chain data refers to information recorded directly onto a blockchain ledger, such as wallet transactions, smart contract executions, and miner activity. Off-chain data consists of exchange order books, trade execution logs, social sentiment feeds, and macro news events occurring outside the blockchain. Integrating both streams through Crypto Data gives traders a complete view of the market.
How does wash trading impact retail crypto investors?
Wash trading creates fake trading volume and artificial order book liquidity. Retail investors who rely on reported exchange volume may buy into an illiquid asset, making it impossible to exit their positions without suffering massive slippage and capital losses.
Why is Fully Diluted Valuation (FDV) more important than current Market Cap?
Market capitalization only measures the current circulating supply, while FDV calculates the theoretical market value once all total tokens are unlocked. A low market cap paired with a massive FDV indicates impending supply inflation, which historically causes downward price pressure as new tokens enter circulation.
How can I protect my trades from MEV sandwich attacks on DEXs?
To defend against MEV front-running, lower your slippage tolerance setting (ideally below 0.5%), trade through non-public MEV-protected RPC endpoints, or utilize non-custodial DEX aggregators that use private transaction submission.
What tools does Empire Crypto Data offer to monitor hidden risks?
Empire Crypto Data offers real-time liquidity health indicators, wash trading detection algorithms, token unlock countdown alerts, smart contract security scanners, and advanced quantitative risk models (including Value at Risk and GARCH volatility forecasting).
Conclusion: Take Control of Your Crypto Journey Today
The cryptocurrency market offers unprecedented financial opportunities, but it also presents novel, complex risks that traditional market analysis simply cannot spot. Relying solely on surface-level price charts exposes your portfolio to wash trading traps, predatory tokenomic unlocks, smart contract exploits, and liquidity cascades.
By utilizing institutional-grade data analytics cryptocurrency methodology, checking reliable cryptocurrency data metrics, and incorporating the comprehensive frameworks shared in this guide, you can effectively insulate your portfolio against hidden market traps.