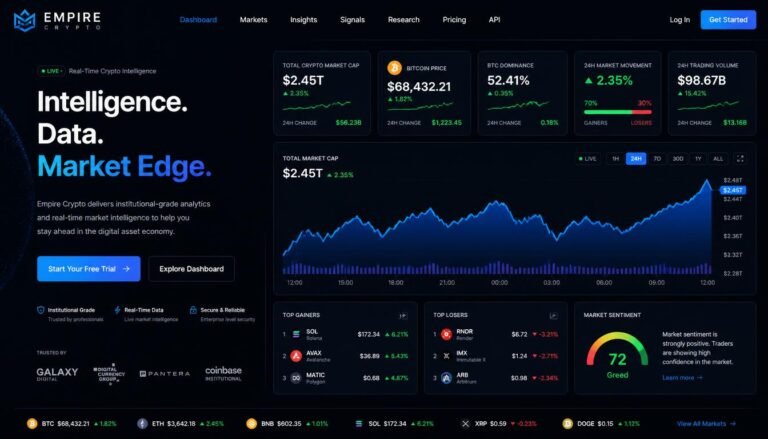
The cryptocurrency market moves at lightning speed, driven by millions of transactions occurring across decentralized networks every single second. For retail investors and experienced traders alike, surviving and thriving in this fast-paced ecosystem requires more than mere intuition or headlines. It demands access to real-time, actionable insights. Welcome to Empire Crypto: Hidden Secrets of Blockchain, your ultimate guide to deciphering the decentralized ledger and unlocking the true potential of digital asset markets. At Empire Crypto, our primary mission is to democratize access to institutional-grade digital asset intelligence.

What is Blockchain Data and Why Does It Hold the Market’s Secrets?
Every time a transaction occurs on a decentralized network like Bitcoin, Ethereum, or Solana, it is permanently recorded on a public ledger. This ledger contains a treasure trove of information—from wallet balances and smart contract executions to miner fees and token movement velocity. This raw information is what experts call crypto data.
Unlike traditional financial markets where market makers and institutional desks operate behind closed doors, public blockchains are completely transparent. However, raw ledger entries are cluttered, noisy, and difficult for the average human to interpret. This is where specialized analytics platforms like Empire Crypto come into play. By aggregating, cleaning, and visualizing on-chain activities, raw block data is transformed into structured, actionable market intelligence.
On-Chain vs. Off-Chain Data: Understanding the Difference
To build a profitable investment framework, you must first distinguish between the two primary categories of digital asset intelligence:
- On-Chain Data: Information recorded directly on the blockchain ledger. This includes wallet addresses, transaction volumes, gas fees, staking yields, smart contract interactions, and hash rates. It represents fundamental network activity and real user adoption.
- Off-Chain Data: Data originating outside the blockchain network itself. This encompasses centralized exchange order books, spot trading volumes, derivatives open interest, funding rates, social media sentiment, and macroeconomic news.
While off-chain metrics reflect short-term trader sentiment and speculative liquidity, on-chain metrics reveal structural supply and demand dynamics. Combining both approaches gives you a 360-degree view of market reality.
Why Traditional Technical Analysis Fails in Decentralized Markets
Standard technical analysis tools—such as Moving Averages, Relative Strength Index (RSI), and MACD—were originally designed for equities and commodities. While they remain useful for identifying price momentum, they suffer from significant limitations when applied to digital assets:
- Susceptibility to Manipulation: Centralized exchange volumes can be inflated through wash trading and spoofing.
- Lagging Indicators: Traditional charts only react after orders execute on an order book.
- Blindness to Capital Transfers: Technical charts cannot tell you whether coins are moving into cold storage for long-term holding or transferring onto exchanges to be dumped.
By incorporating high-conviction cryptocurrency data into your analysis, you stop trading blind and start making decisions based on actual economic activity.
Empire Crypto: Uncovering the Hidden Secrets of Blockchain
Behind the complex web of cryptographic hashes lie predictable patterns governed by incentives, liquidity flow, and human behavior. Below are four hidden secrets that professional funds use to stay ahead of retail traders.
Secret 1: Smart Money and Whale Tracking
Large holders—commonly referred to as “whales”—control a significant portion of the total circulating supply of major cryptocurrencies. When a whale moves thousands of Bitcoin or Ethereum tokens, it inevitably impacts market prices.
With advanced monitoring features from Empire Crypto, you can track wallet clusters belonging to venture funds, market makers, and early protocol adopters. Instead of reacting to price crashes after they happen, on-chain tracking allows you to see whale accumulation and distribution phases in real time.
- Exchange Inflows: A sudden spike in tokens moving from private wallets into centralized exchanges signals potential selling pressure.
- Exchange Outflows: Massive withdrawals from exchanges into self-custodial wallets indicate long-term accumulation and supply illiquidity.
- Whale Wallet Clustering: Grouping multiple addresses managed by a single entity to detect coordinated market movements before retail catches on.
Secret 2: Unfiltered Order Flow and Liquidity Pools
In Decentralized Finance (DeFi), market liquidity is locked in Automated Market Maker (AMM) pools rather than traditional order books. Watching liquidity additions and removals across decentralized exchanges (DEXs) like Uniswap or Curve provides an early indicator of token demand.
When institutional capital injects millions into a specific liquidity pair, it creates a floor price and reduces slippage. Conversely, sudden liquidity withdrawals (“rug pulls” or strategic exits) signal an impending price drop. Tracking DEX liquidity dynamics reveals where real capital is committing for the long run.
Secret 3: Mempool Monitoring and Pre-Trade Intelligence
Before a transaction is confirmed and included in a blockchain block, it waits in a public staging area called the mempool. Monitoring the mempool reveals transactions queued for execution, providing a glimpse into near-future block states.
Using state-of-the-art infrastructure developed by Empire Crypto, traders can detect high-value swaps, liquidation events, and arbitrage opportunities before they finalize on-chain. This mempool visibility helps you avoid front-running bots, optimize gas fees, and enter positions ahead of major volatility spikes.
Secret 4: Tokenomics and Supply Dynamics Metrics
Price alone is a misleading metric in cryptocurrency markets. A token trading at $0.0001 can easily be far more expensive than a token trading at $500 if its circulating supply is vastly larger. To evaluate true value, smart investors focus on core supply mechanics:
- Market Cap vs. Fully Diluted Valuation (FDV): If a project has a low circulating market cap but a massive FDV, upcoming token unlocks will flood the market with new supply, creating persistent price headwinds.
- Inflation vs. Burn Rates: Protocols with dynamic fee-burning mechanisms (like Ethereum’s EIP-1559) can shift from inflationary to deflationary based on network usage.
- Staking Lockup Ratios: A high percentage of supply locked in consensus staking reduces liquid supply, making the asset far more responsive to positive demand shocks.
Beginner’s Guide to Cryptocurrency Data Analytics
Navigating the world of data analytics cryptocurrency tools can feel overwhelming when you are just starting out. However, mastering a few core concepts will transform how you evaluate digital asset opportunities.
Essential On-Chain Metrics for Beginners
If you are new to analyzing crypto market data, start by tracking these foundational metrics:
- Active Addresses: The total number of unique wallet addresses participating in transactions over a given timeframe (daily, weekly, monthly). Sustained growth in daily active addresses indicates healthy network adoption.
- Network Transaction Volume: The total fiat value transferred across the network. High transaction volume paired with rising price confirms a strong, organic uptrend.
- NVT Ratio (Network Value to Transactions): Often referred to as the crypto equivalent of the Price-to-Earnings (P/E) ratio in stock markets. It compares market cap to on-chain transaction volume:$$\text{NVT Ratio} = \frac{\text{Market Capitalization}}{\text{Daily On-Chain Transaction Volume}}$$
- High NVT: Indicates potential overvaluation relative to network usage.
- Low NVT: Suggests the asset is undervalued compared to its actual utility and transfer volume.
- MVRV Z-Score (Market Value to Realized Value): A powerful metric that identifies historical macro tops and bottoms. Realized value calculates the price of each coin when it last moved on-chain, eliminating lost or dormant supply from market cap calculations.
How to Read Crypto Market Data Without Getting Overwhelmed
To avoid analysis paralysis, structure your research workflow using a top-down approach:
- Step 1: Check Macro Market Conditions. Evaluate overall market health by reviewing Bitcoin dominance, total crypto market cap, and stablecoin supply growth.
- Step 2: Assess Network Health. Look at transaction activity, new address creation, and active smart contract usage for the specific layer-1 or layer-2 blockchain.
- Step 3: Analyze Asset-Specific Flows. Check exchange netflows, whale concentration, and derivative market metrics (such as funding rates and liquidation levels).
- Step 4: Review Tokenomics and Unlocks. Confirm there are no immediate cliff unlocks scheduled for team members or private investors.
Real-World Example: Spotting a Market Bottom
Consider a scenario where the price of Bitcoin has dropped 30% over three weeks. Mainstream news outlets report panic, and social media sentiment reaches extreme fear. A novice trader might panic-sell their assets.
However, an investor leveraging on-chain data reviews the following metrics:
- MVRV Z-Score: Drops into the historical green accumulation zone ($< 0.1$).
- Exchange Netflow: Shows massive net outflows of 45,000 BTC moving into non-custodial cold storage.
- SOPR (Spent Output Profit Ratio): Drops below $1.0$, indicating that sellers are capitulating at a loss—a classic signature of a market bottom.
Instead of selling out of fear, the data-driven investor recognizes this convergence as a high-probability buying opportunity. Two months later, as the market recovers 50%, the value of analytical precision becomes crystal clear.
Advanced Trading Data Analysis Cryptocurrency Strategies
For intermediate and institutional traders, basic on-chain metrics are only the starting point. Maximizing edge requires combining high-frequency exchange metrics with advanced on-chain behavioral models.
Sentiment Analysis Meets On-Chain Data
Market sentiment moves prices in the short term, but fundamental usage dictates long-term trajectory. Combining social sentiment tracking with real-time on-chain data creates a powerful divergence strategy:
- Bullish Divergence: Social sentiment reaches extreme negativity, but active addresses and exchange outflows continue to break new highs. This indicates smart money is quietly accumulating while retail remains fearful.
- Bearish Divergence: Social media hype reaches euphoric levels, but transaction volume declines and exchange inflows spike. This indicates insiders are unloading positions into retail enthusiasm.
Cross-Chain Data Correlation & Arbitrage Identification
In today’s multi-chain ecosystem, liquidity is fragmented across Ethereum, Arbitrum, Solana, Avalanche, and dozens of specialized Layer-2 rollups. Capital shifts rapidly between these ecosystems seeking maximum yield and lower transaction overhead.
By utilizing high-speed data analytics cryptocurrency tools, institutional quantitative desks identify cross-chain yield discrepancies and token pricing imbalances. Tracking bridge flows allows you to spot capital migrating toward emerging Layer-1 or Layer-2 ecosystems weeks before those ecosystem tokens experience massive price expansions.
Derivatives Market Metrics: Options Skew and Liquidation Heatmaps
Derivatives markets (futures, perpetual swaps, and options) often drive spot prices due to heavy leverage. Advanced traders monitor three key derivative indicators:
- Funding Rates: Periodic payments made between long and short traders in perpetual futures markets. Consistently high positive funding rates mean the market is over-leveraged long, increasing the risk of a long squeeze cascade.
- Open Interest (OI): The total value of outstanding derivative contracts. Rising Open Interest combined with stagnant price signals an explosive volatility expansion is imminent.
- Liquidation Heatmaps: Visual representations of price levels where large clusters of leveraged positions will face forced liquidation. Market makers and algorithmic algorithms frequently drive prices toward these high-density liquidation pools to sweep liquidity.
About Empire Crypto Data Solutions
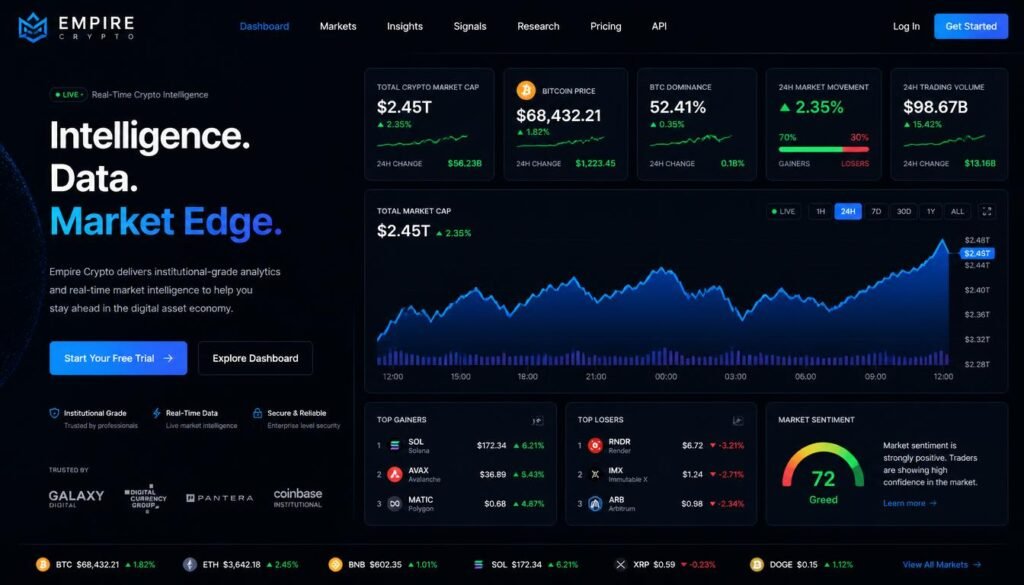
In an industry filled with raw noise, fragmented information, and unreliable signals, Empire Crypto stands out as a premier crypto data company committed to delivering enterprise-grade market analytics.
Why Empire Crypto is the Leading Crypto Data Solution
Navigating cryptocurrency markets without accurate tools is like flying an airplane without dashboard instruments. At Empire Crypto, our suite of analytics tools bridges the gap between complex blockchain code and profitable decision-making.
Our platform processes billions of on-chain events daily across major blockchain networks, translating raw cryptographic logs into clean, visual dashboards. Whether you are conducting fundamental research on new DeFi protocols or optimizing high-frequency trading algorithms, our solutions provide the speed, depth, and clarity you need.
Cryptocurrency Data Reliability: Eliminating Noise and Wash Trading
One of the biggest challenges in the digital asset industry is data integrity. Centralized exchanges frequently report inflated trading volumes to artificially boost their rankings, while decentralized networks suffer from spam transactions and MEV (Maximal Extractable Value) bot activity.
At Empire Crypto, cryptocurrency data reliability is our highest priority. Our proprietary data-cleaning pipeline employs advanced machine learning algorithms to:
- Filter Wash Trading: Identify and eliminate artificial volume generated by self-referential trading loops on unregulated exchanges.
- Cluster Wallet Entities: Accurately identify exchange hot wallets, miner pools, institutional custodians, and individual whale entities.
- Normalize Multi-Chain Metrics: Standardize transaction counting methodologies across disparate blockchain architectures (UTXO vs. Account-based models).
When you rely on Empire Crypto for your market research, you can rest assured that every metric, chart, and alert reflects true market reality—not artificial noise.
Real-World Use Cases: How Traders Capitalize on Blockchain Secrets
To understand the practical impact of advanced analytics, let us examine three concrete scenarios where data-driven traders outmaneuver the broader market.
Use Case 1: Early Token Discovery in DeFi
Finding promising decentralized finance projects before they rally requires monitoring developer activity and smart contract adoption rather than relying on social media chatter.
The Strategy:
A trader sets up automated tracking alerts using customized crypto market data parameters:
- Monitor smart contract deployments with weekly contract interaction growth $> 200\%$.
- Filter for protocols where unique user wallets exceed 5,000 within the first 14 days.
- Verify that liquidity provider (LP) tokens are locked in smart contracts for at least 12 months.
The Result:
The trader identifies a promising decentralized lending protocol 3 weeks before its official marketing campaign launches. By accumulating the token during its quiet organic growth phase, the trader captures a 450% gain when mainstream attention finally arrives.
Use Case 2: Risk Mitigation During Volatile Market Swings
Protecting capital during severe market downturns is just as critical as capturing upside gains. On-chain metrics provide early warning signs of systemic liquidation risks.
The Strategy:
During an extended bull run, a risk manager monitors derivatives leverage alongside exchange deposit metrics:
When all three conditions trigger simultaneously, the manager reduces portfolio leverage from 3x to spot cash, moving 50% of holdings into stablecoins.
The Result:
Forty-eight hours later, a flash crash wipes out $1.2 billion in leveraged long positions across the industry. While the broader market suffers a 25% drawdown, the trader’s portfolio remains secure, preserving capital to buy back top-tier assets at discounted prices.
Use Case 3: Optimizing Yield Farming and Staking Strategies
Yield farming in DeFi offers high annualized percentage yields (APYs), but impermanent loss and inflationary token emissions can quickly turn paper profits into actual losses.
The Strategy:
A DeFi yield strategist uses analytical feeds from Empire Crypto to evaluate pool sustainability:
- Compare protocol fee revenue against token emission rewards.
- Track pool liquidity concentration to estimate potential impermanent loss across volatility bands.
- Monitor whale wallet exit queues in staking pools.
The Result:
The strategist avoids high-yield “farm and dump” traps, allocating capital exclusively into revenue-backed pools that generate real yield from actual trading fees, resulting in stable, compounding returns over time.
Comparing Data Analytics Cryptocurrency Platforms
To select the best crypto data solution for your trading style, evaluate how different analytics approaches compare across key functionality metrics:
| Feature / Metric | Basic Block Explorers | Traditional Price Charts | Advanced Analytics by Empire Crypto |
| Primary Focus | Raw Transaction Logs | Price & Volume Candlesticks | Comprehensive Market Intelligence |
| Target User | Developers & General Public | Retail Technical Traders | Quantitative & Fundamental Investors |
| Whale Tracking | Manual & Fragmented | Non-Existent | Automated Entity Clustering |
| Data Cleaning | Unfiltered Raw Data | Exchange-Provided Data | AI Wash-Trading & Spam Filtering |
| Derivatives & Mempool | None | Basic Exchange Feeds | Real-Time Liquidation & Order Flow |
| Multi-Chain Support | Single Chain Per Site | Ticker-Based | Unified Cross-Chain Normalization |
While basic block explorers and standard charting websites provide starting points, they lack the entity resolution and real-time processing required for modern crypto market analysis. Choosing a comprehensive platform like Empire Crypto gives you institutional-grade instruments scaled for everyday trading success.
Frequently Asked Questions (FAQ)
What is crypto data and why is it important for trading?
Crypto data encompasses all on-chain network metrics (such as active addresses, transaction volumes, and smart contract activity) and off-chain market feeds (such as order book liquidity and derivatives funding rates). It is vital because it reveals real supply and demand mechanics, helping traders make data-backed decisions instead of relying on market speculation or emotion.
How does Empire Crypto help traders make better decisions?
Empire Crypto aggregates raw blockchain metrics from multiple networks, filters out spam and wash trading, and translates complex ledger information into clean visual dashboards. By offering whale tracking, mempool monitoring, and normalized tokenomics metrics, the platform helps users discover opportunities early and manage market risk effectively.
What is the difference between on-chain data and off-chain data?
On-chain data refers to transactions and activities recorded directly on a decentralized blockchain ledger (e.g., wallet transfers, gas fees, staking lockups). Off-chain data includes activity occurring outside the blockchain, such as order books on centralized exchanges, social media sentiment, and traditional financial market indicators.
Why is cryptocurrency data reliability crucial for market analysis?
Many centralized platforms report inflated trading volumes due to wash trading, while blockchains experience noise from automated MEV bots. High data reliability ensures that metrics are filtered and normalized, presenting an accurate picture of organic economic activity so investors can trust their analytical models.
Can beginners use blockchain data analytics effectively?
Yes! While raw blockchain code is complex, modern analytics tools present insights through simple visual indicators such as active address charts, NVT ratios, and exchange flow dashboards. Beginners can start by tracking fundamental metrics like exchange netflows and wallet growth before progressing to advanced derivatives analysis.
Conclusion: Master the Market with Empire Crypto
The era of relying on luck, social media speculation, and outdated technical indicators in digital asset markets has come to an end. Blockchain technology provides an unprecedented level of financial transparency, but capturing that advantage requires the right tools and knowledge.
By mastering the hidden secrets of the blockchain—from whale tracking and mempool monitoring to supply dynamics and derivatives metrics—you unlock a sustainable competitive edge. Whether you are a newcomer taking your first steps in Web3 or an experienced trader refining a quantitative strategy, taking full advantage of the analytics suite from Empire Crypto empowers you to navigate market cycles with confidence.
Don’t trade in the dark while smart money operates with full visibility. Step into the future of digital asset analytics, unlock the true power of on-chain intelligence, and transform your trading journey with Empire Crypto today!